 (1).png)
 1 hour ago
139
1 hour ago
139
ARTICLE AD BOX
TLDR
- Dogecoin is testing a third multi-month descending trendline breakout, a pattern that previously led to 230% and 350% gains
- A golden cross between 100-day SMA ($0.2192) and 200-day EMA ($0.2199) is forming, historically signaling extended bullish phases
- 21Shares filed an amended SEC registration for a Dogecoin ETF under ticker TDOG, classifying DOGE as a “meme coin” but not a security
- Current price hovers around $0.24, with key resistance at $0.33 and support at $0.18
- A developing cup and handle pattern on the weekly chart suggests potential for significant upside if $0.4846 resistance breaks
Dogecoin is once again capturing market attention as it tests critical technical levels while a major ETF filing adds institutional interest to the popular meme coin.
The cryptocurrency is pressing against a familiar technical setup on the weekly chart. Crypto analyst Cantonese Cat highlighted that DOGE has completed its third multi-month descending trendline test in as many cycles.
Price is now hovering just below a quarter dollar after a brief breakout and early retest. This pattern has proven powerful in previous cycles.
On the 1-week timeframe, the chart shows three distinct bear-market trendlines and subsequent expansions. Each breakout has led to major price increases.
The first downtrend, drawn from late-2022 swing highs through mid-2023 lower highs, was broken in September 2023. From that breakout point, DOGE advanced roughly 230%.
The second sequence repeated across late-2023 into 2024. An April–June 2024 distribution created a fresh descending line that capped price through October 2024.
When a weekly close pushed through that line, it triggered the next impulse. From that October 2024 breakout, the advance extended about 350% into the late-2024 peak near $0.48.
Price action since the November–December 2024 high carved the third descending trendline. Over the past several candles, DOGE pushed through that line, then slipped back toward it.
This produced what traders call a classic “return move” on reduced momentum. As of September 29, 2025, DOGE trades around $0.2369 on the weekly chart.
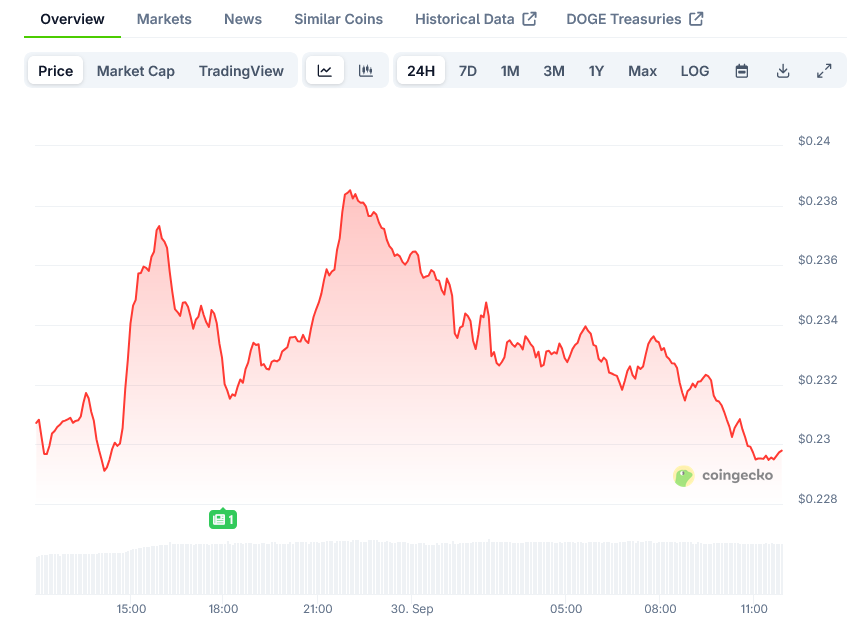 Dogecoin Price on CoinGecko
21Shares Files for Dogecoin ETF
Adding fuel to Dogecoin’s potential breakout is news that 21Shares has filed an amended SEC registration for a Dogecoin ETF under the ticker “TDOG.”
The European asset manager, already offering crypto ETPs in Europe, would be launching its first Dogecoin product in the U.S. if approved.
In the filing, the SEC labels DOGE among “meme coins,” alongside the likes of SHIB, but makes a key distinction by emphasizing that DOGE is not considered a security.
This development has coincided with a brief rally. On the filing news, Dogecoin’s price jumped roughly 10% intraday.
The updated S-1 prospectus reportedly mentions Dogecoin’s characteristics, including its uncapped supply – a key difference from Bitcoin.
It highlighted that 21Shares’ filing explicitly groups DOGE with other “non-security” meme tokens. This signals the SEC’s stance that Dogecoin is viewed as a crypto asset, not an investment contract.
Traders largely view these filings as bullish crypto news, drawing comparisons to how Bitcoin and Ethereum ETF approvals impacted those assets.
Technical Setup Points to Higher Targets
Crypto analyst Cas Abbé is closely monitoring the daily chart, where a golden cross between the 100-day SMA ($0.2192) and the 200-day EMA ($0.2199) is forming.
$DOGE golden cross is approaching soon 👀
This is one of the alts I'm paying very close attention to.
The reason is very simple: When DOGE pumps, Altseason starts.
If DOGE manages to pump above $0.33, alts will go bonkers. pic.twitter.com/AcO8nN9oVF
— Cas Abbé (@cas_abbe) September 29, 2025
Historically, such crossovers have signaled the beginning of extended bullish phases. Abbé stressed the broader market impact of a Dogecoin rally.
“DOGE golden cross is approaching soon. This is one of the alts I’m paying very close attention to. When DOGE pumps, Altseason starts,” he noted.
His key threshold is $0.33, a resistance level that has capped multiple rallies. A clean break above it could accelerate capital rotation into the broader altcoin market.
Liquidity dynamics add nuance to the technical picture. Cryptoinsightuk shared a liquidity heatmap indicating dense bids around $0.18.
Supply concentrations above $0.30 form notable resistance zones. Many traders are positioning for downside liquidity sweeps before potential continuation higher.
Currently trading near $0.229, DOGE sits at the intersection of conflicting signals. The historical pattern of breakouts from descending trendlines and the imminent golden cross argue for bullish continuation.
On the other hand, liquidity maps suggest vulnerability to deeper retracements toward $0.20–0.18 before any sustained rally.
CobraVanguard provided analysis of the DOGE/USDT weekly chart, highlighting a developing cup and handle pattern that could set Dogecoin up for explosive growth.
The “cup” portion has already fully formed, beginning from a peak of $0.760 in May 2021 and shaping into a U-shaped curve that concluded at the $0.4846 price level by December 2024.
Since peaking in December 2024, Dogecoin slipped into a handle-like pattern, mirroring the broader meme coin pullback.
The chart indicates that Dogecoin price must break resistance near $0.4846 to validate the cup-and-handle setup. That move would mark a 102% jump from its current $0.240 level.
Dogecoin’s price is currently holding at around the $0.240 support level, a key point that analysts believe could trigger a rebound if it holds steady.


 English (US) ·