 (1).png)
 1 hour ago
152
1 hour ago
152
ARTICLE AD BOX
Ethereum is currently attempting to stabilize after the recent sell-off that pushed prices below key levels. While the bullish trend structure hasn’t been fully broken on higher timeframes, both price action and on-chain metrics are showing mixed signals that traders should closely monitor.
Technical Analysis
By Shayan
The Daily Chart
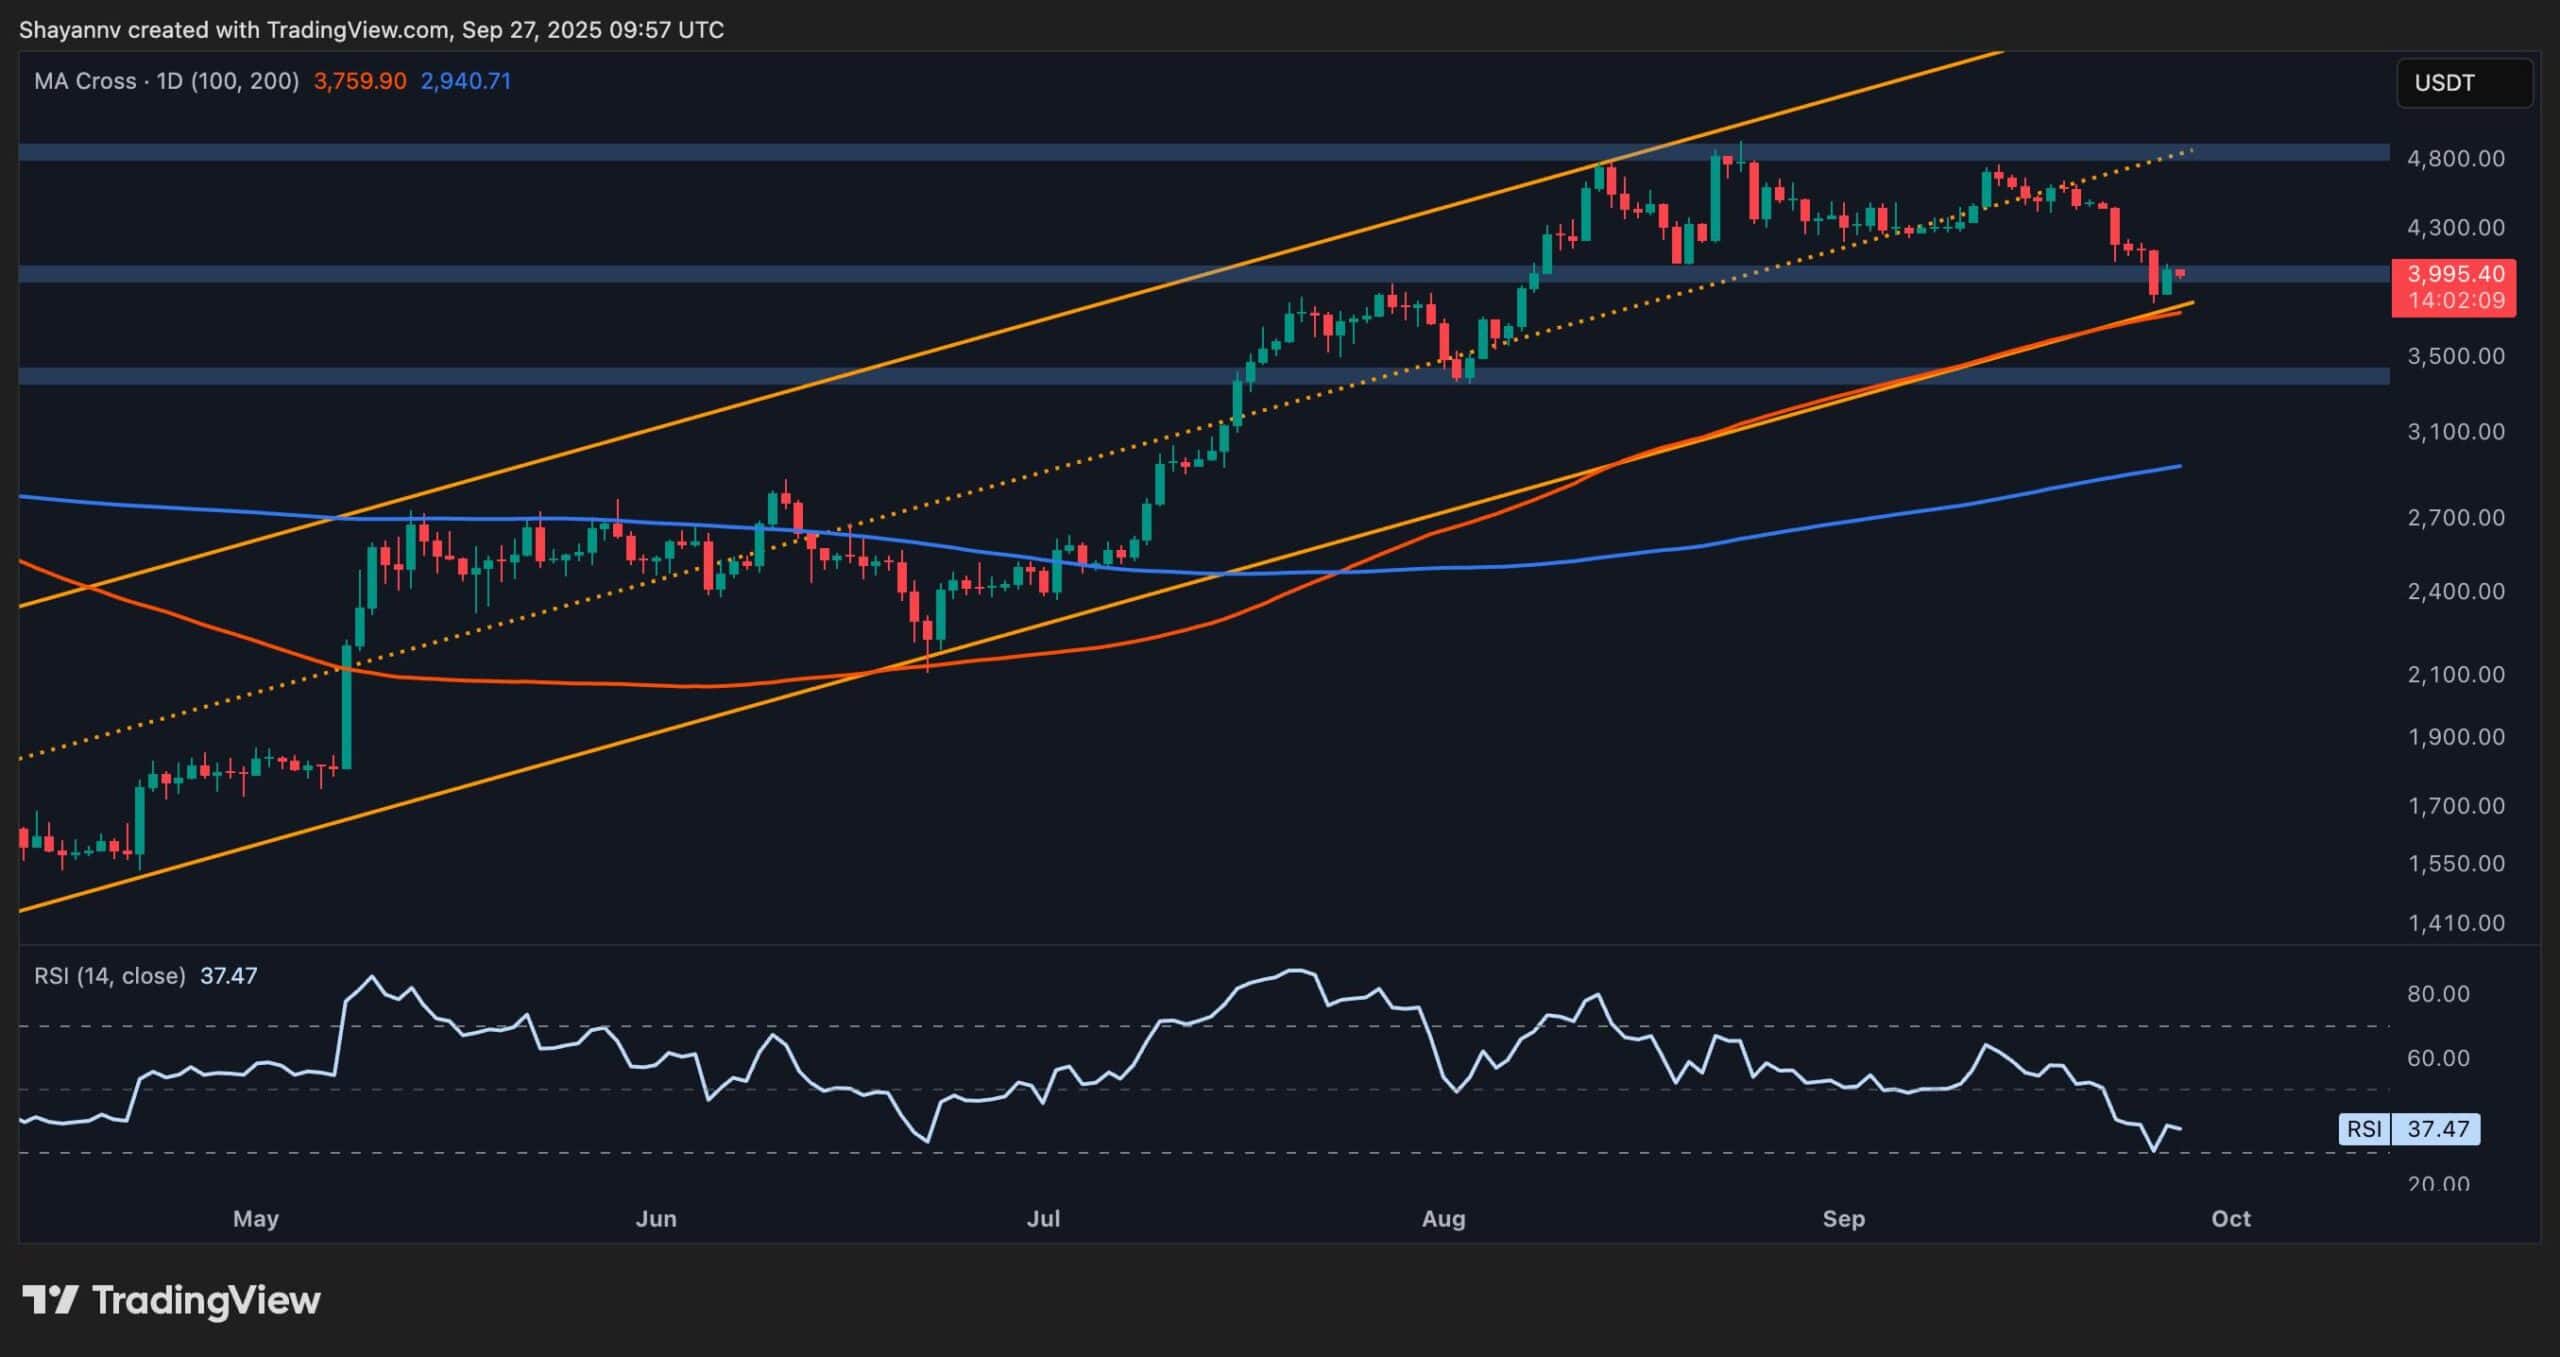
On the daily chart, ETH has lost the midline of its ascending channel, breaking below the dotted trendline that had supported the price since August. The asset is now testing the $4,000 key level, which aligns closely with the lower boundary of the channel and the 100-day moving average located around the $3,800 level.
The RSI has also dipped near the oversold region but has rebounded slightly and is now hovering around 40, hinting at a possible local bottom if buyers step in with volume. However, if the asset breaks below the $4,000 level, a deeper drop toward the $3.5K range could be expected, which would officially put the market in a downtrend situation.
The 4-Hour Chart
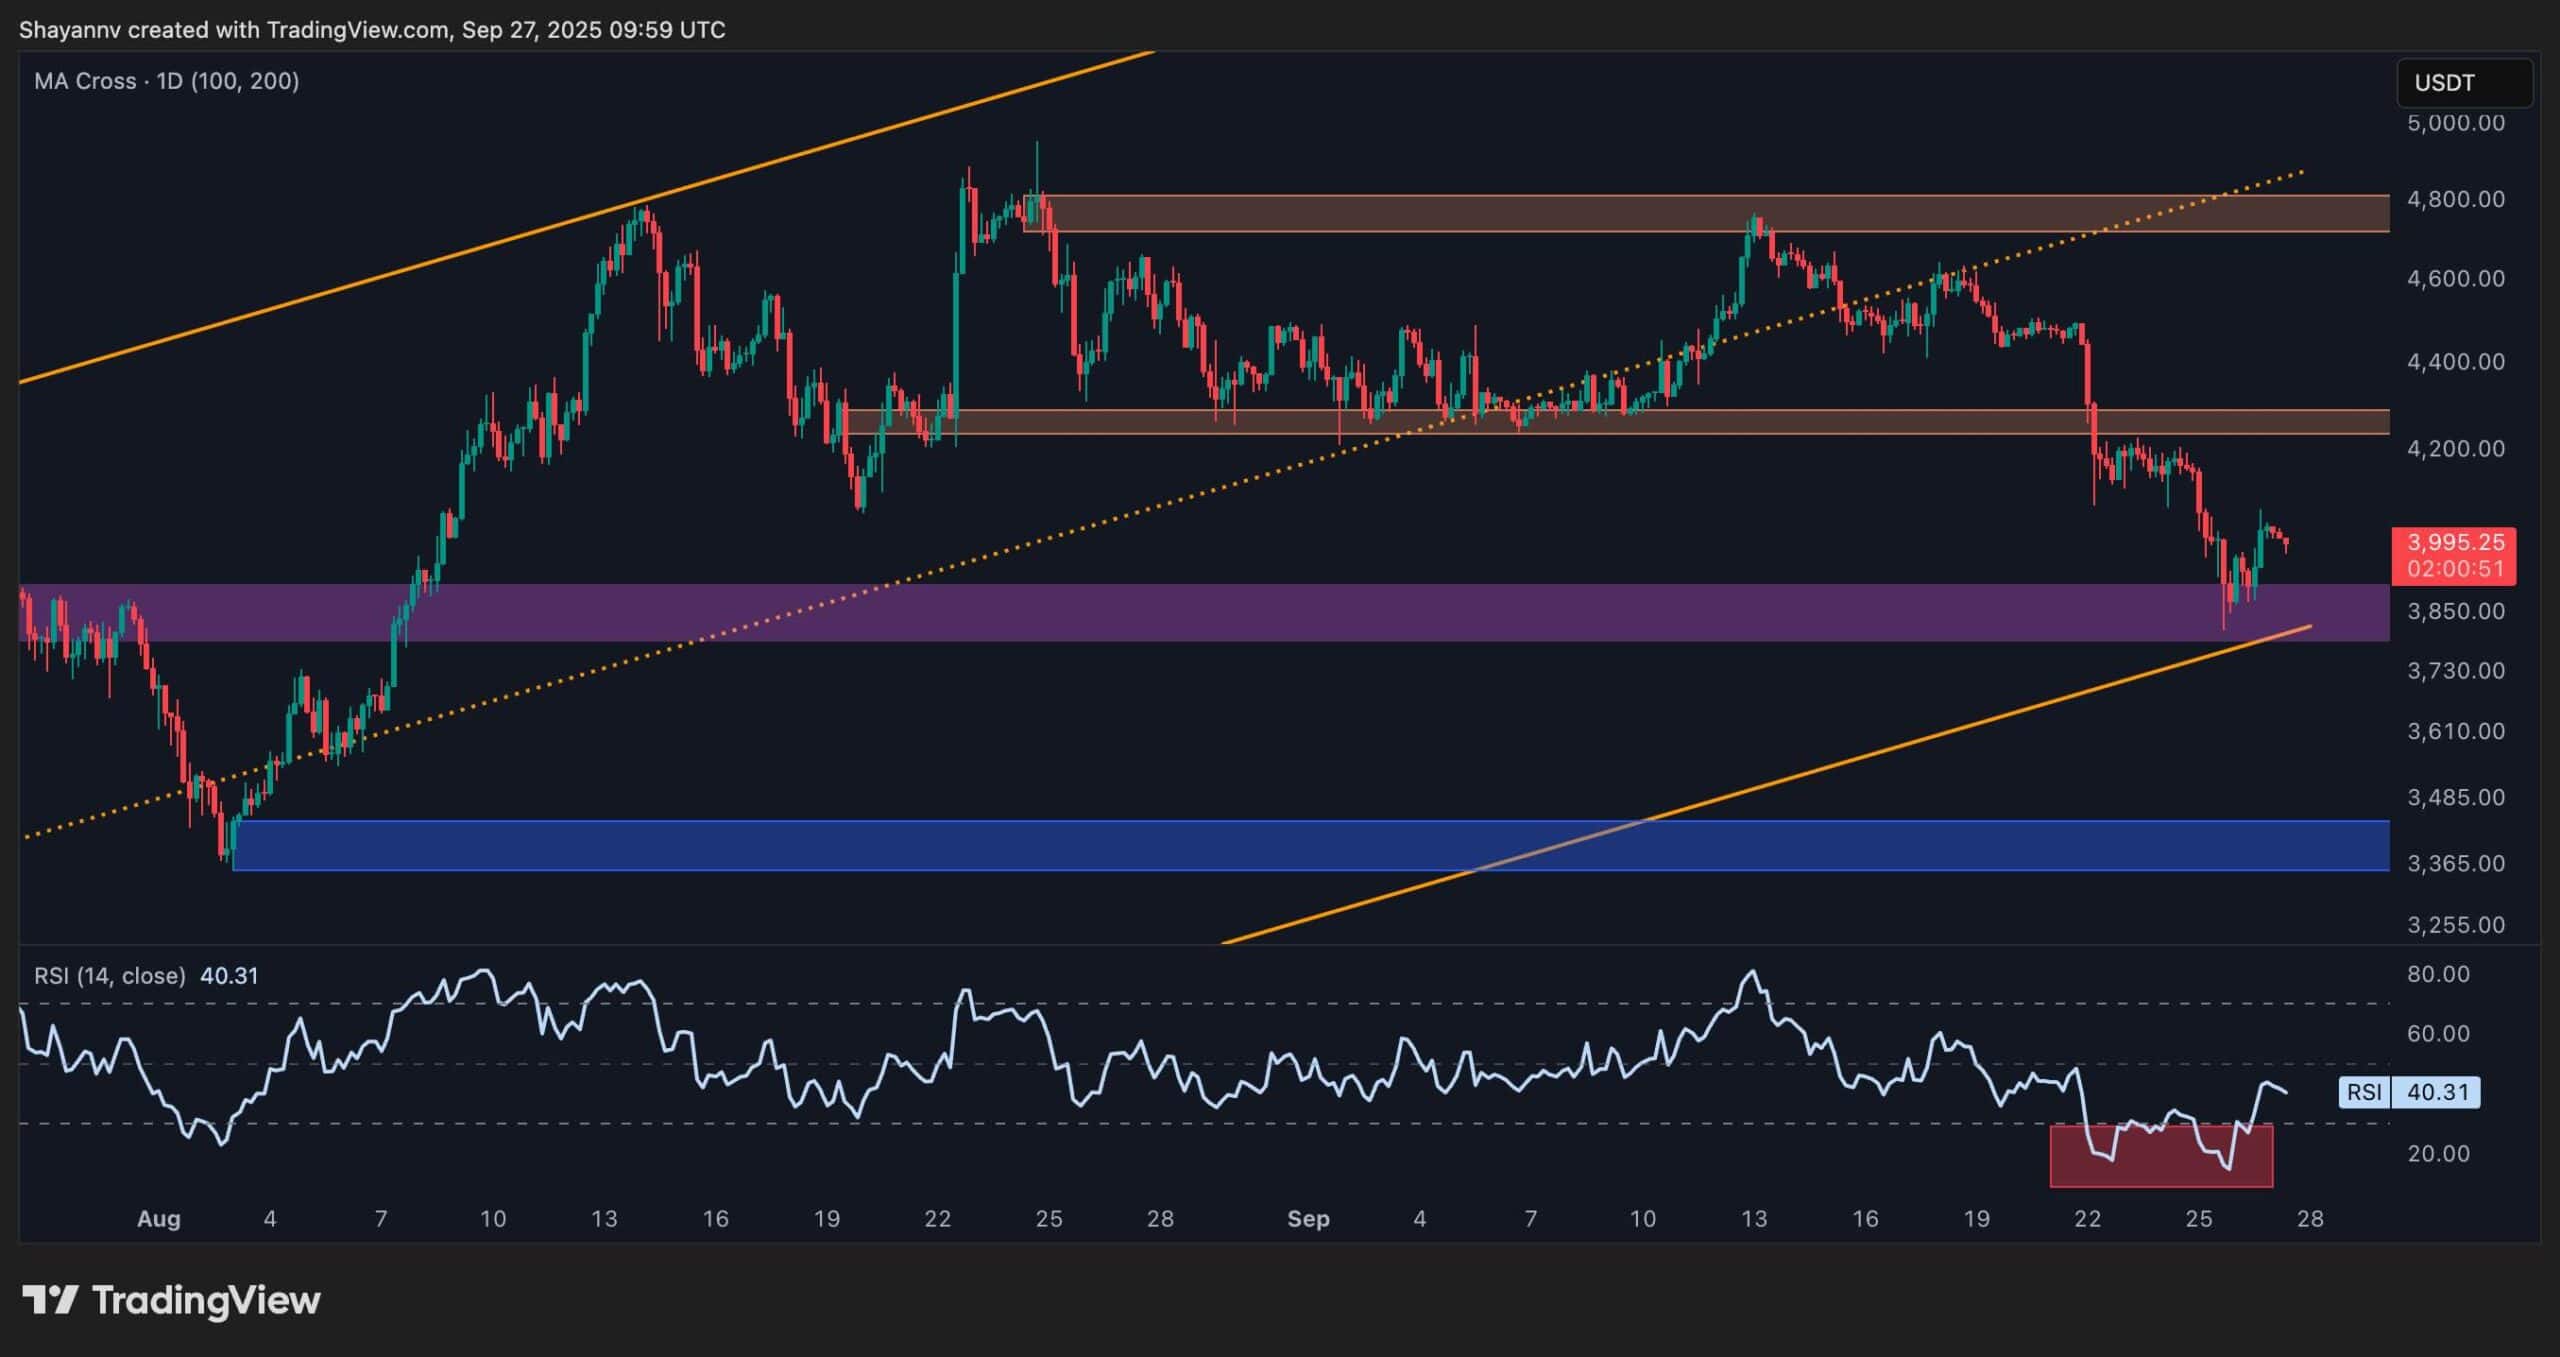
On the 4-hour chart, ETH shows signs of a short-term rebound after reaching the purple demand zone around $3,850. The price bounced quite sharply from this zone and is now consolidating just below $4K. This move forms a potential short-term bottom, especially since RSI has exited oversold territory and is now trending up.
That said, the structure remains bearish as long as ETH stays below $4,200 level. If buyers can reclaim that level, momentum could shift back in favor of a bullish move. Otherwise, a drop toward the $3,500 area would be very probable in the coming weeks.
Onchain Analysis
Exchange Supply Ratio
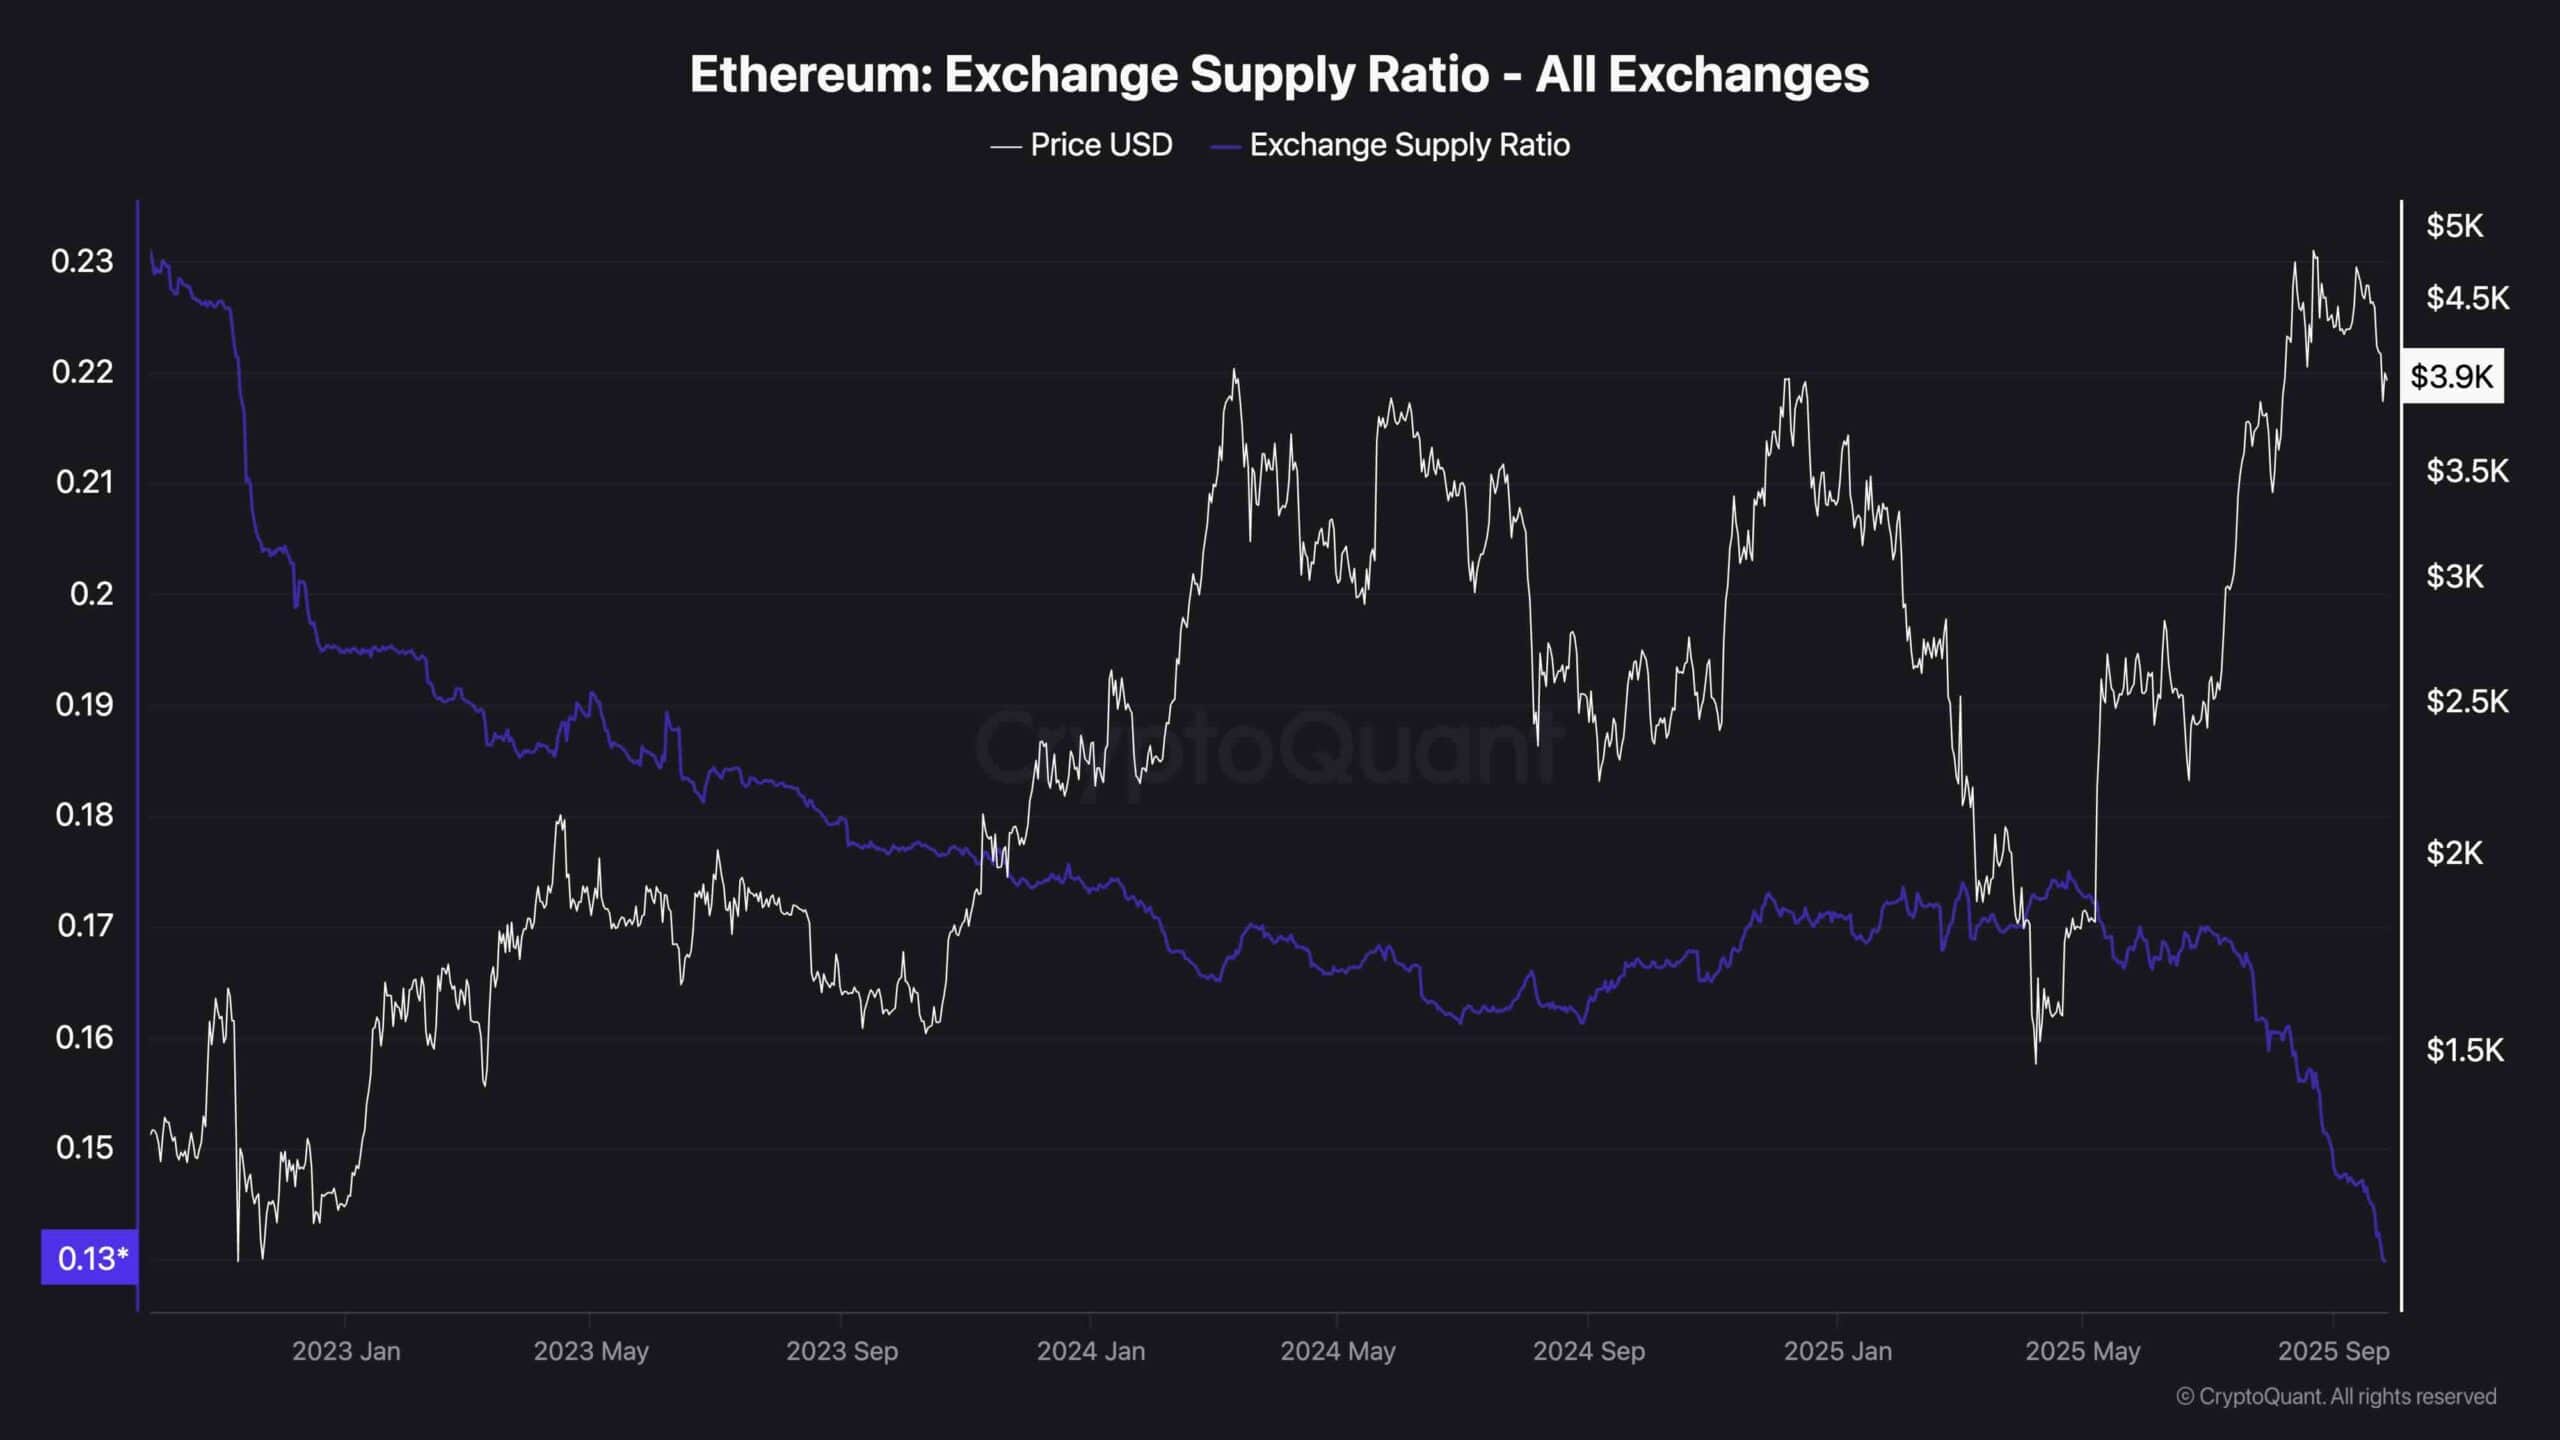
On the on-chain data front, Ethereum’s Exchange Supply Ratio continues to trend downward, now sitting at its lowest point in years, near 0.13. This shows that a declining portion of the total ETH supply is held on centralized exchanges, suggesting a strong long-term accumulation trend. Historically, this has been a bullish signal, as it means fewer tokens are readily available for selling.
However, this accumulation trend contrasts with the recent price action. While fewer ETH are sitting on exchanges, the price still dropped sharply, possibly due to short-term leverage wipeouts or broader market sentiment. In any case, this metric supports the idea that long-term holders remain confident, and unless we see a sudden reversal in exchange inflows, the macro bullish structure stays intact.
Binance Free $600 (CryptoPotato Exclusive): Use this link to register a new account and receive $600 exclusive welcome offer on Binance (full details).
LIMITED OFFER for CryptoPotato readers at Bybit: Use this link to register and open a $500 FREE position on any coin!
Disclaimer: Information found on CryptoPotato is those of writers quoted. It does not represent the opinions of CryptoPotato on whether to buy, sell, or hold any investments. You are advised to conduct your own research before making any investment decisions. Use provided information at your own risk. See Disclaimer for more information.
Cryptocurrency charts by TradingView.


 English (US) ·