 (1).png)
 2 hours ago
170
2 hours ago
170
ARTICLE AD BOX
TLDR:
- The Bitcoin 60-day Buy/Sell Pressure Delta has flipped, suggesting bulls may step in at current levels.
- Coin days destroyed show long-term holders reducing selling activity compared to earlier this year.
- Buy liquidity clusters around $105K while sell liquidity stacks near $120K, setting up a breakout zone.
- Bitcoin trades at $109,555 with a slight 24-hour gain but remains 5% lower over the past week.
Bitcoin is holding its ground near $109K, but traders are preparing for the next move. On-chain signals are starting to turn, hinting at a potential shift in momentum. Short-term price action remains choppy, leaving investors debating whether to buy now or wait.
Liquidity levels show a clear battle forming between buyers and sellers. Analysts see this as a point where bulls may try to regain control.
Bitcoin Buy/Sell Pressure Delta Points to Entry Zone
Analyst Joao Wedson shared that the 60-day Buy/Sell Pressure Delta has already entered what he calls the “opportunity zone.”
🎯 Buy/Sell Pressure Delta Signals a Bitcoin Opportunity!
On September 9, I suggested waiting for the Buy/Sell Pressure Delta to move into the negative zone. In that post, I used the 90-day delta, which is slower and more conservative — perfect for filtering out noise.
Now, the… https://t.co/TIJGtYtHQE pic.twitter.com/rTYoyyufW9
— Joao Wedson (@joao_wedson) September 27, 2025
He explained that the 90-day delta, which is slower and more conservative, is still approaching confirmation. This gives traders two choices: enter early with moderate risk or wait a few more days for a safer signal.
Wedson noted that the shift in the 60-day delta is a sign that bears may face buying pressure soon.
He suggested that bulls could use this period to accumulate BTC at current prices. This aligns with traders looking for lower-risk entries after a week of price weakness.
Liquidity and Long-Term Holder Behavior
Data from Alphractal shows that the CDD Multiple, which tracks long-term holder spending, has fallen compared to 2024. This means older coins are moving at a slower rate, a pattern seen during accumulation phases. It suggests experienced holders are sitting tight and waiting for stronger price action.
$BTC HEATMAP IS SCREAMING.
Sell liquidity stacked at $120K.
Last buy liquidity resting at $105K.
Whales decide direction.
Retail just gets harvested.
This setup is about to erupt.
Survive this trap, and you win the game. pic.twitter.com/20CMtBorCp
— Merlijn The Trader (@MerlijnTrader) September 28, 2025
Trader Merlijn added that Bitcoin’s heatmap is showing heavy sell liquidity stacked near $120K and last strong buy liquidity near $105K.
He warned that whales control the next move, and retail traders risk being caught in the middle. With volatility compressed, traders expect a breakout once one side absorbs the other’s liquidity.
Per CoinGecko, Bitcoin is trading at $109,555 with a 0.19% daily gain but remains down 5.37% in the past seven days. Trading volume over the last 24 hours stands at $21.4 billion, showing steady market activity while participants wait for direction.
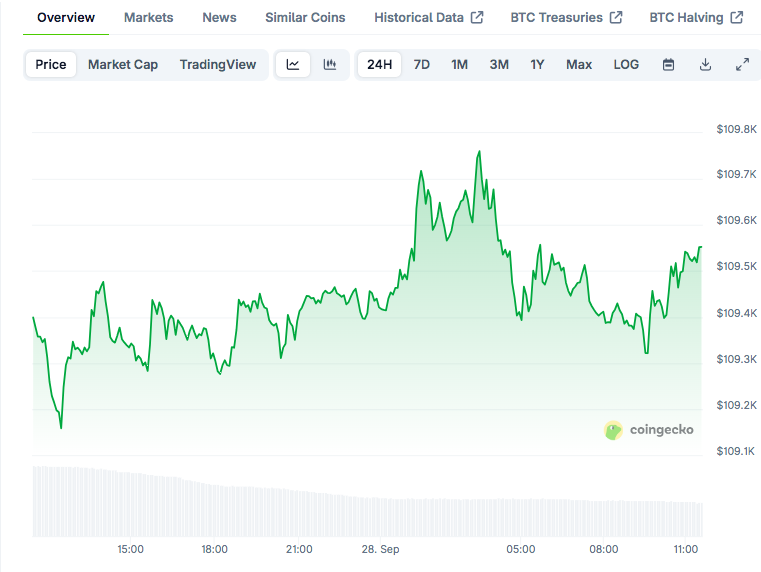 BTC price on CoinGecko


 English (US) ·